Memory Graph
The Memory Graph is a visual representation of your Knowledge Base, allowing you to explore the relationships and density of your stored memories.
1. Accessing the Graph
Section titled “1. Accessing the Graph”To open the visualization interface:
- Enter your workspace.
- Select the desired cluster.
- Navigate to the Graph tab in the top menu bar.
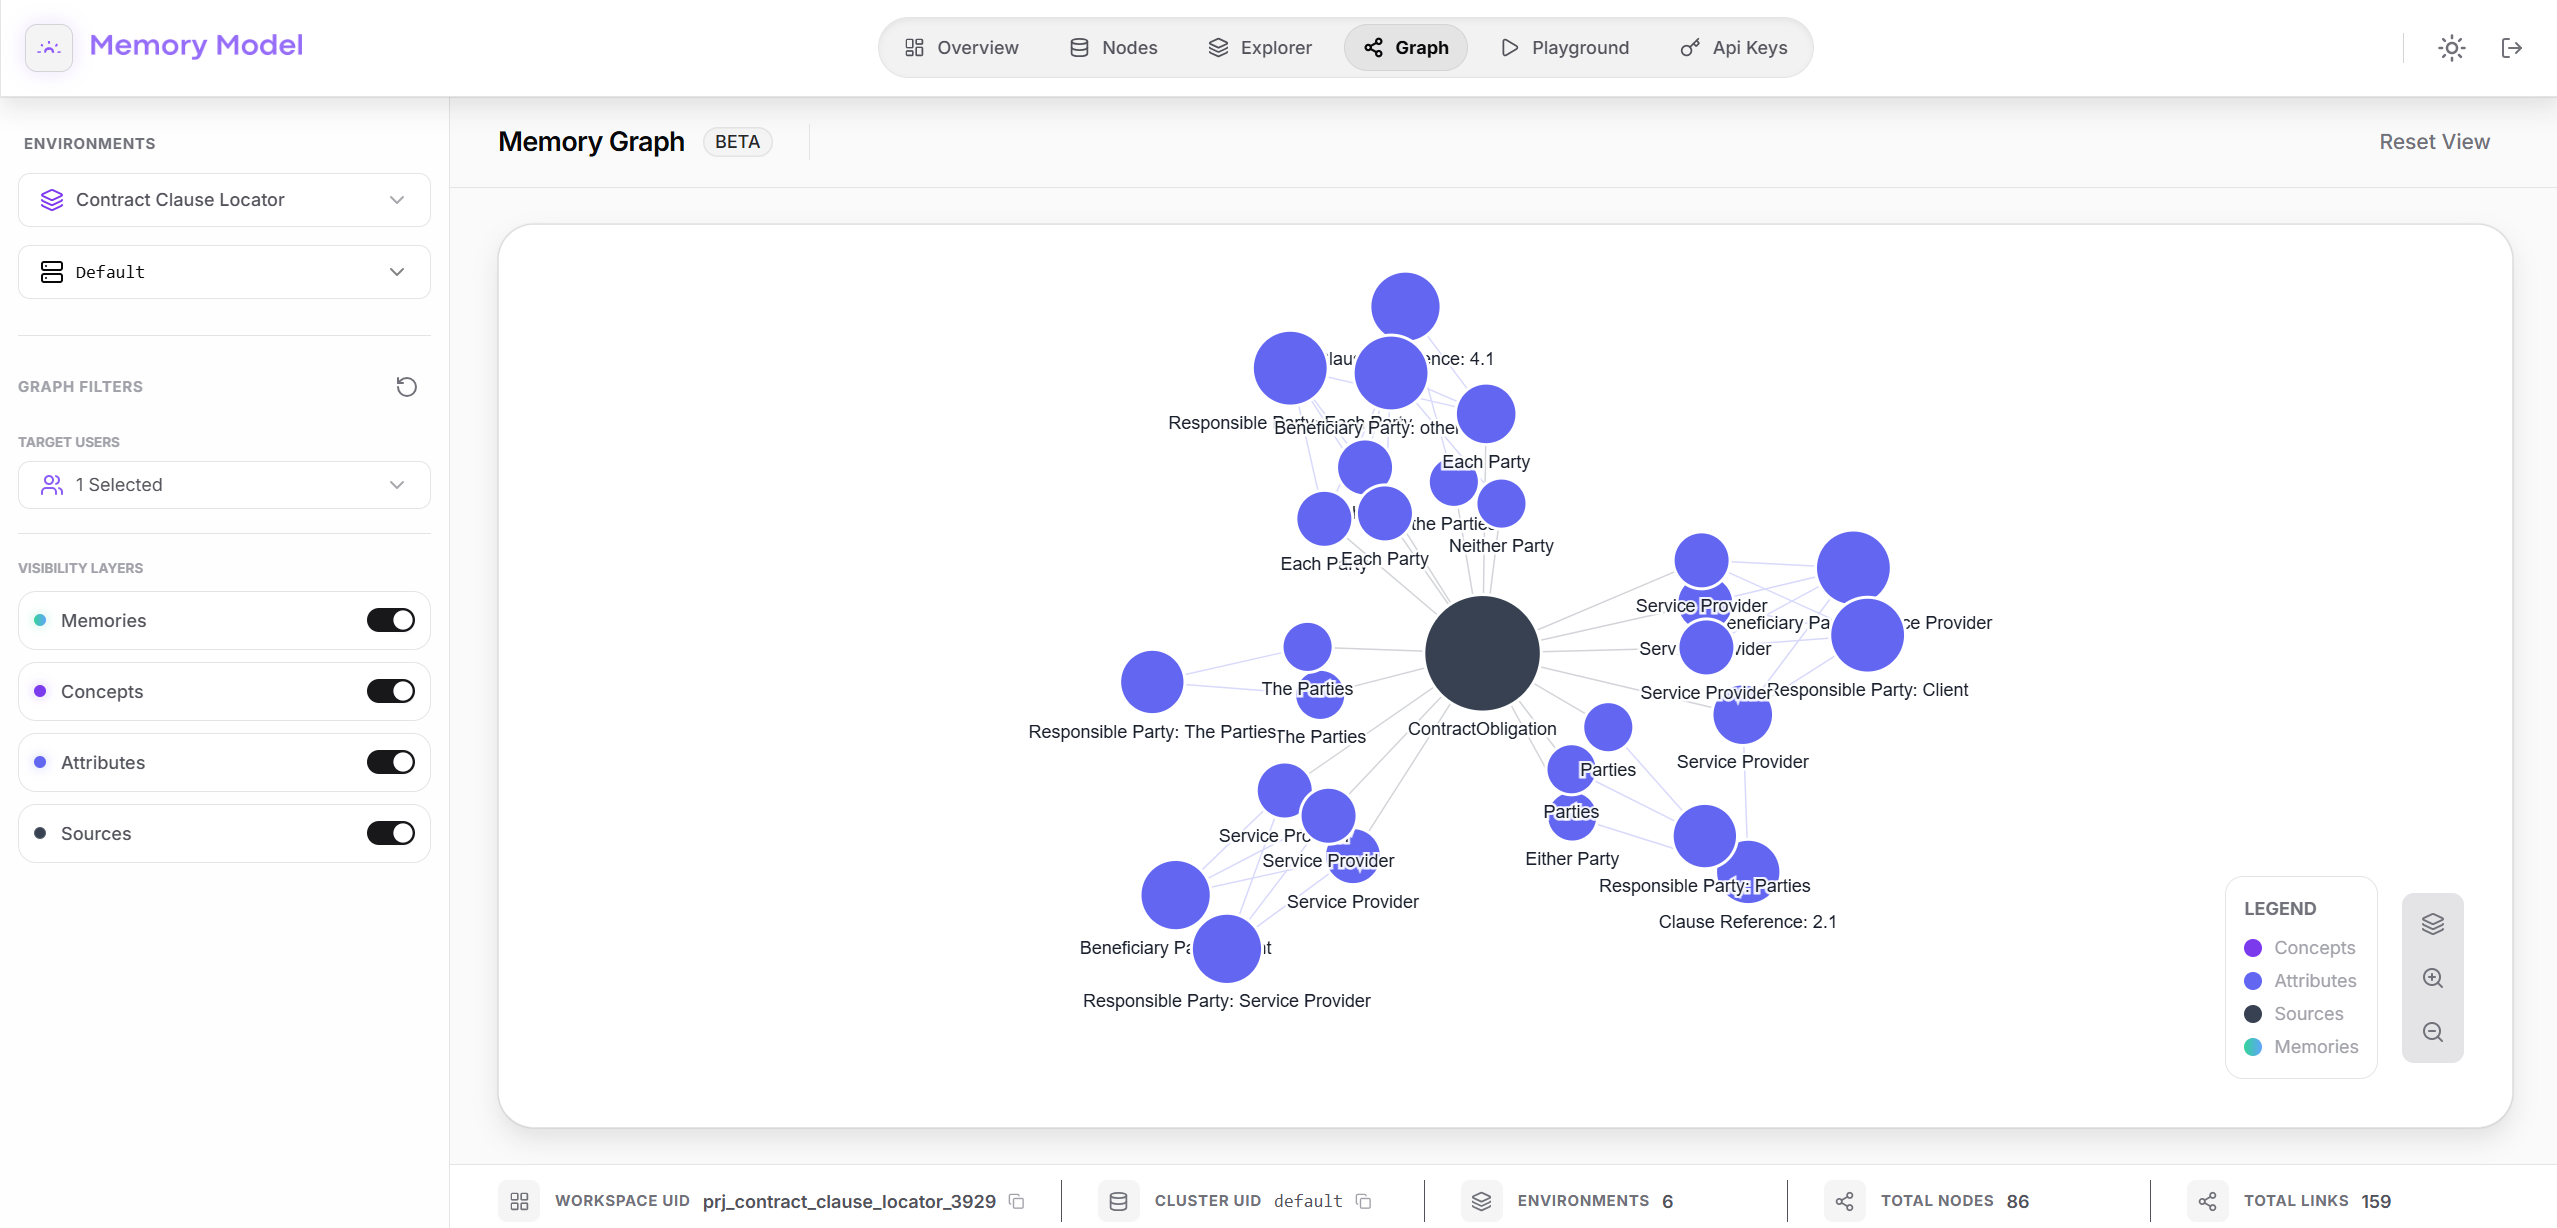
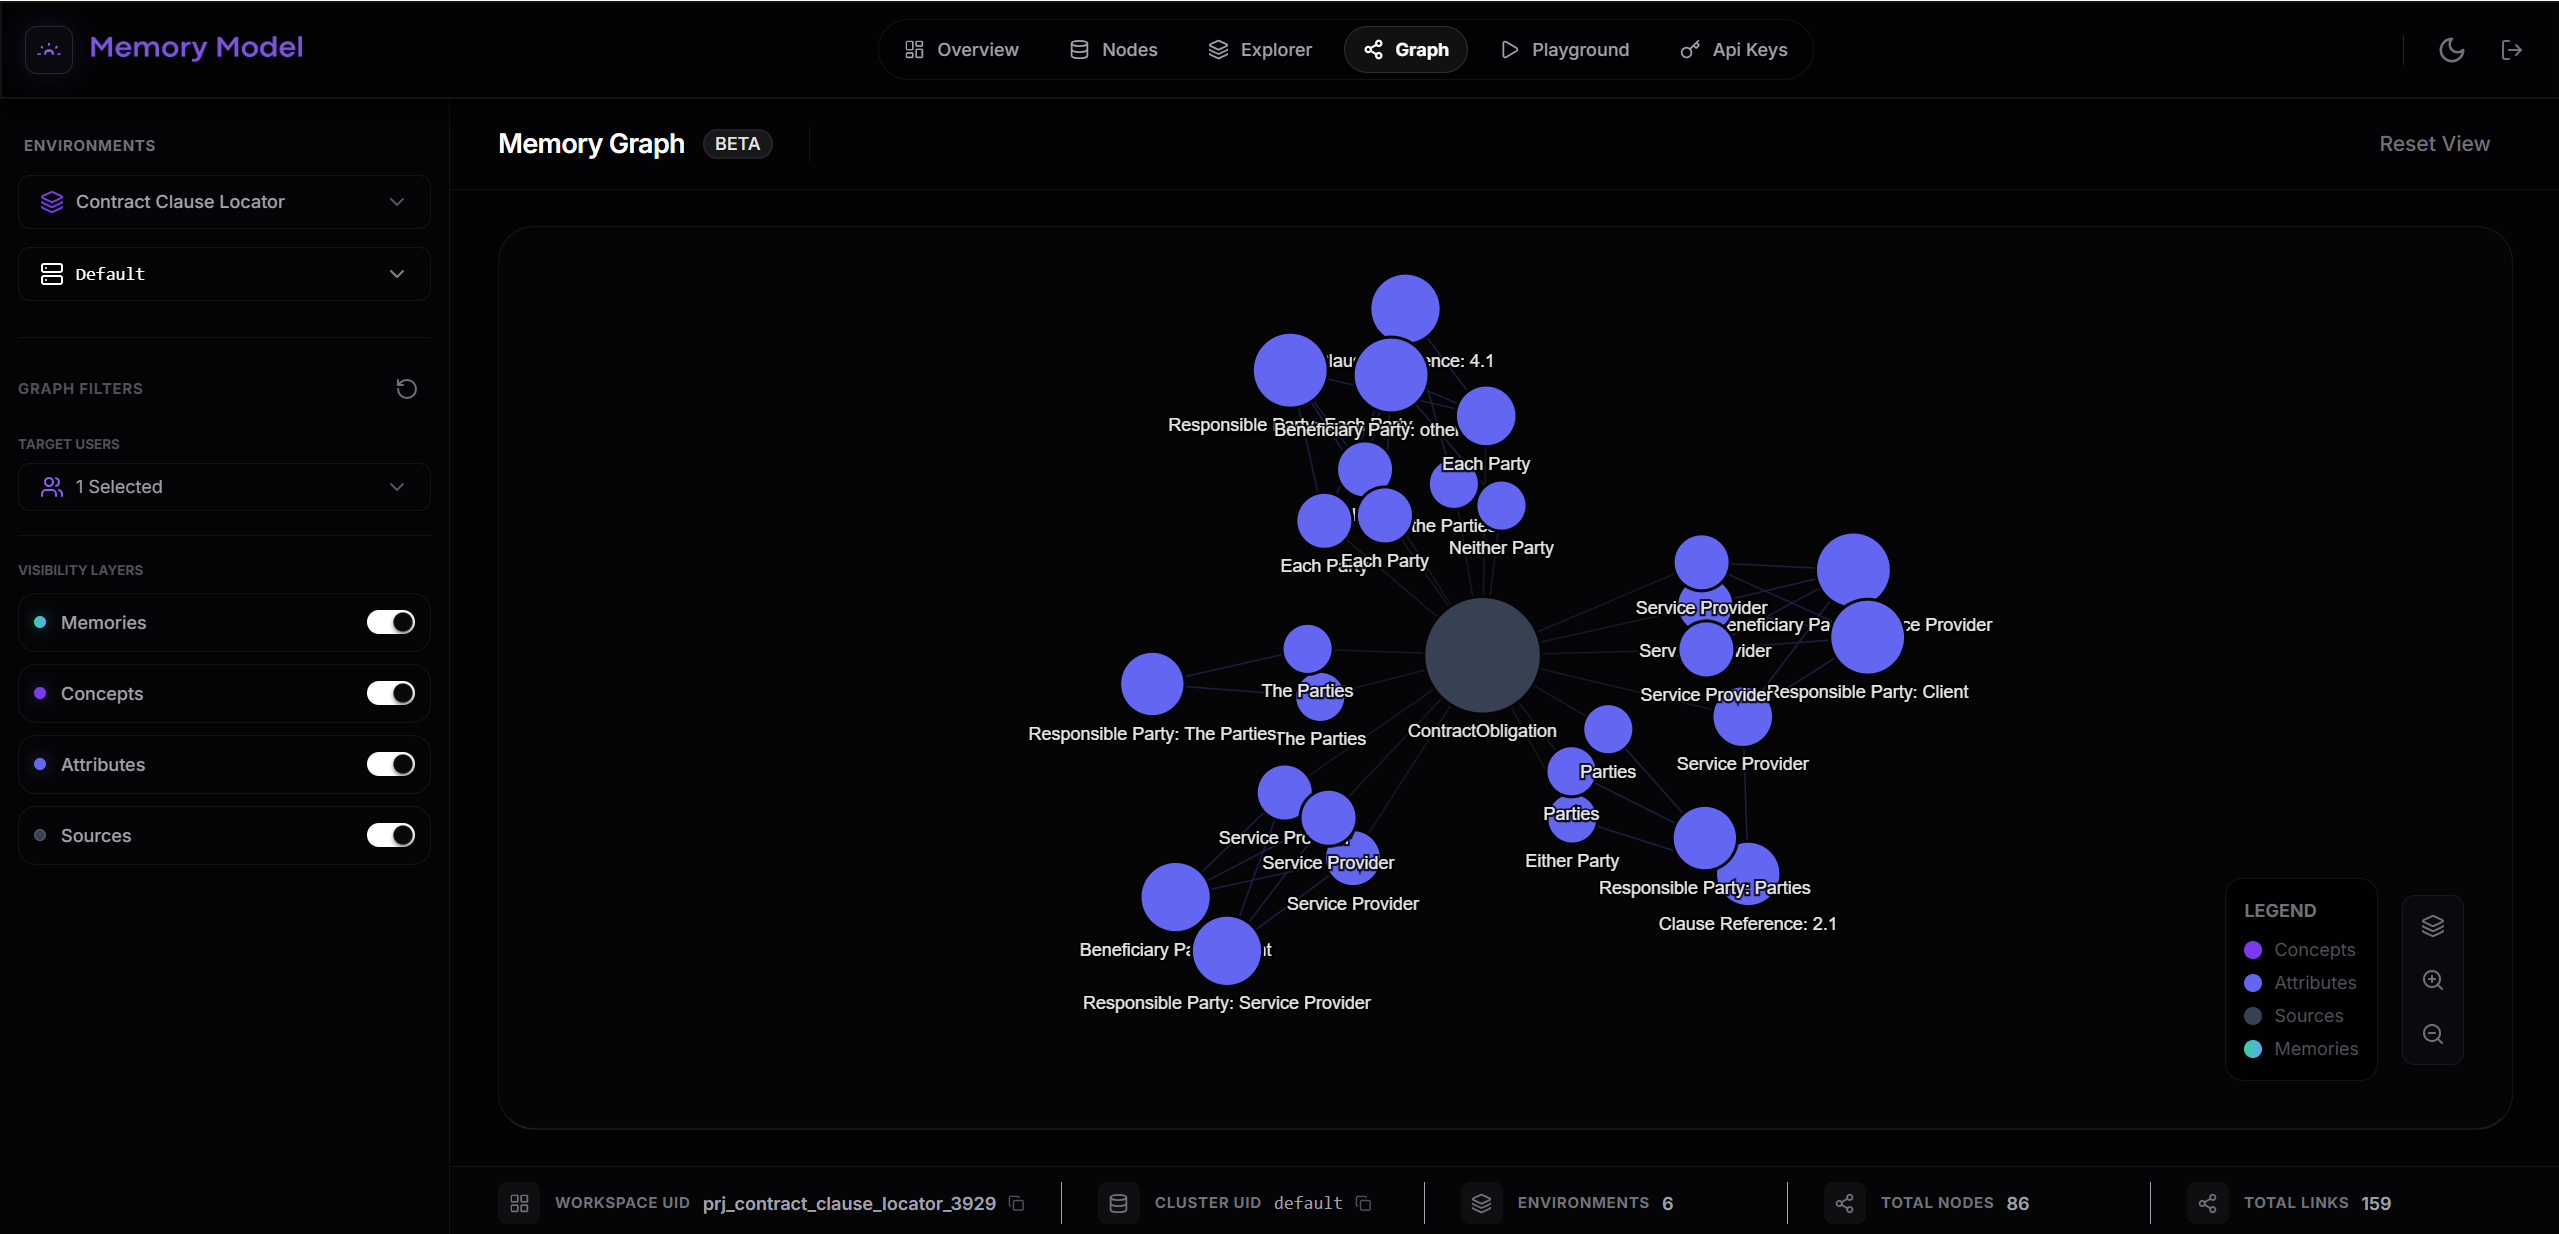
2. Interactive Topology
Section titled “2. Interactive Topology”The central pane displays your Knowledge Base as a dynamic network:
- Nodes: Represent specific memory clusters (e.g.,
UserProfile,SalesInsight,AppKnowledge). - Links: Visual lines representing the semantic connections and relationships between these data points.
- Stats: A summary at the top left (e.g., 70 Memories • 113 Links) gives you an immediate metric of your graph’s density.
3. Filtering and Navigation
Section titled “3. Filtering and Navigation”Customize your view to focus on specific data segments:
- Graph Filters: Located in the left sidebar, this allows you to filter the graph by “Target Users” (e.g., selecting specific users to view their combined knowledge graph).
- View Controls: Use the toolset in the bottom right corner to Fit the graph to the screen, or Zoom In/Out to explore specific clusters in detail.