Explore & manage memory
The Explorer is the primary interface to inspect, debug, and understand memory inside Memory Model. It is not a dashboard for metrics. It is a memory introspection tool — built to answer one question: What does my agent remember, and why?
What the Explorer is for
Section titled “What the Explorer is for”When you build long-living agents, memory becomes a system component. The Explorer exists to give you control and explainability over that component.
You use the Explorer to:
- Inspect stored memories (nodes)
- Understand how and when they were written
- See how relevance evolves over time
- Debug retrieval behavior
- Verify that isolation, scope, and policies are respected
If something looks wrong in your agent’s behavior, the Explorer is where you go first.
Accessing the Explorer
Section titled “Accessing the Explorer”To view and inspect memories:
- Enter your workspace
- Select the desired cluster
- Navigate to the Explorer tab
This opens the Memory Explorer, the main interface for live memory inspection.
Using the Explorer
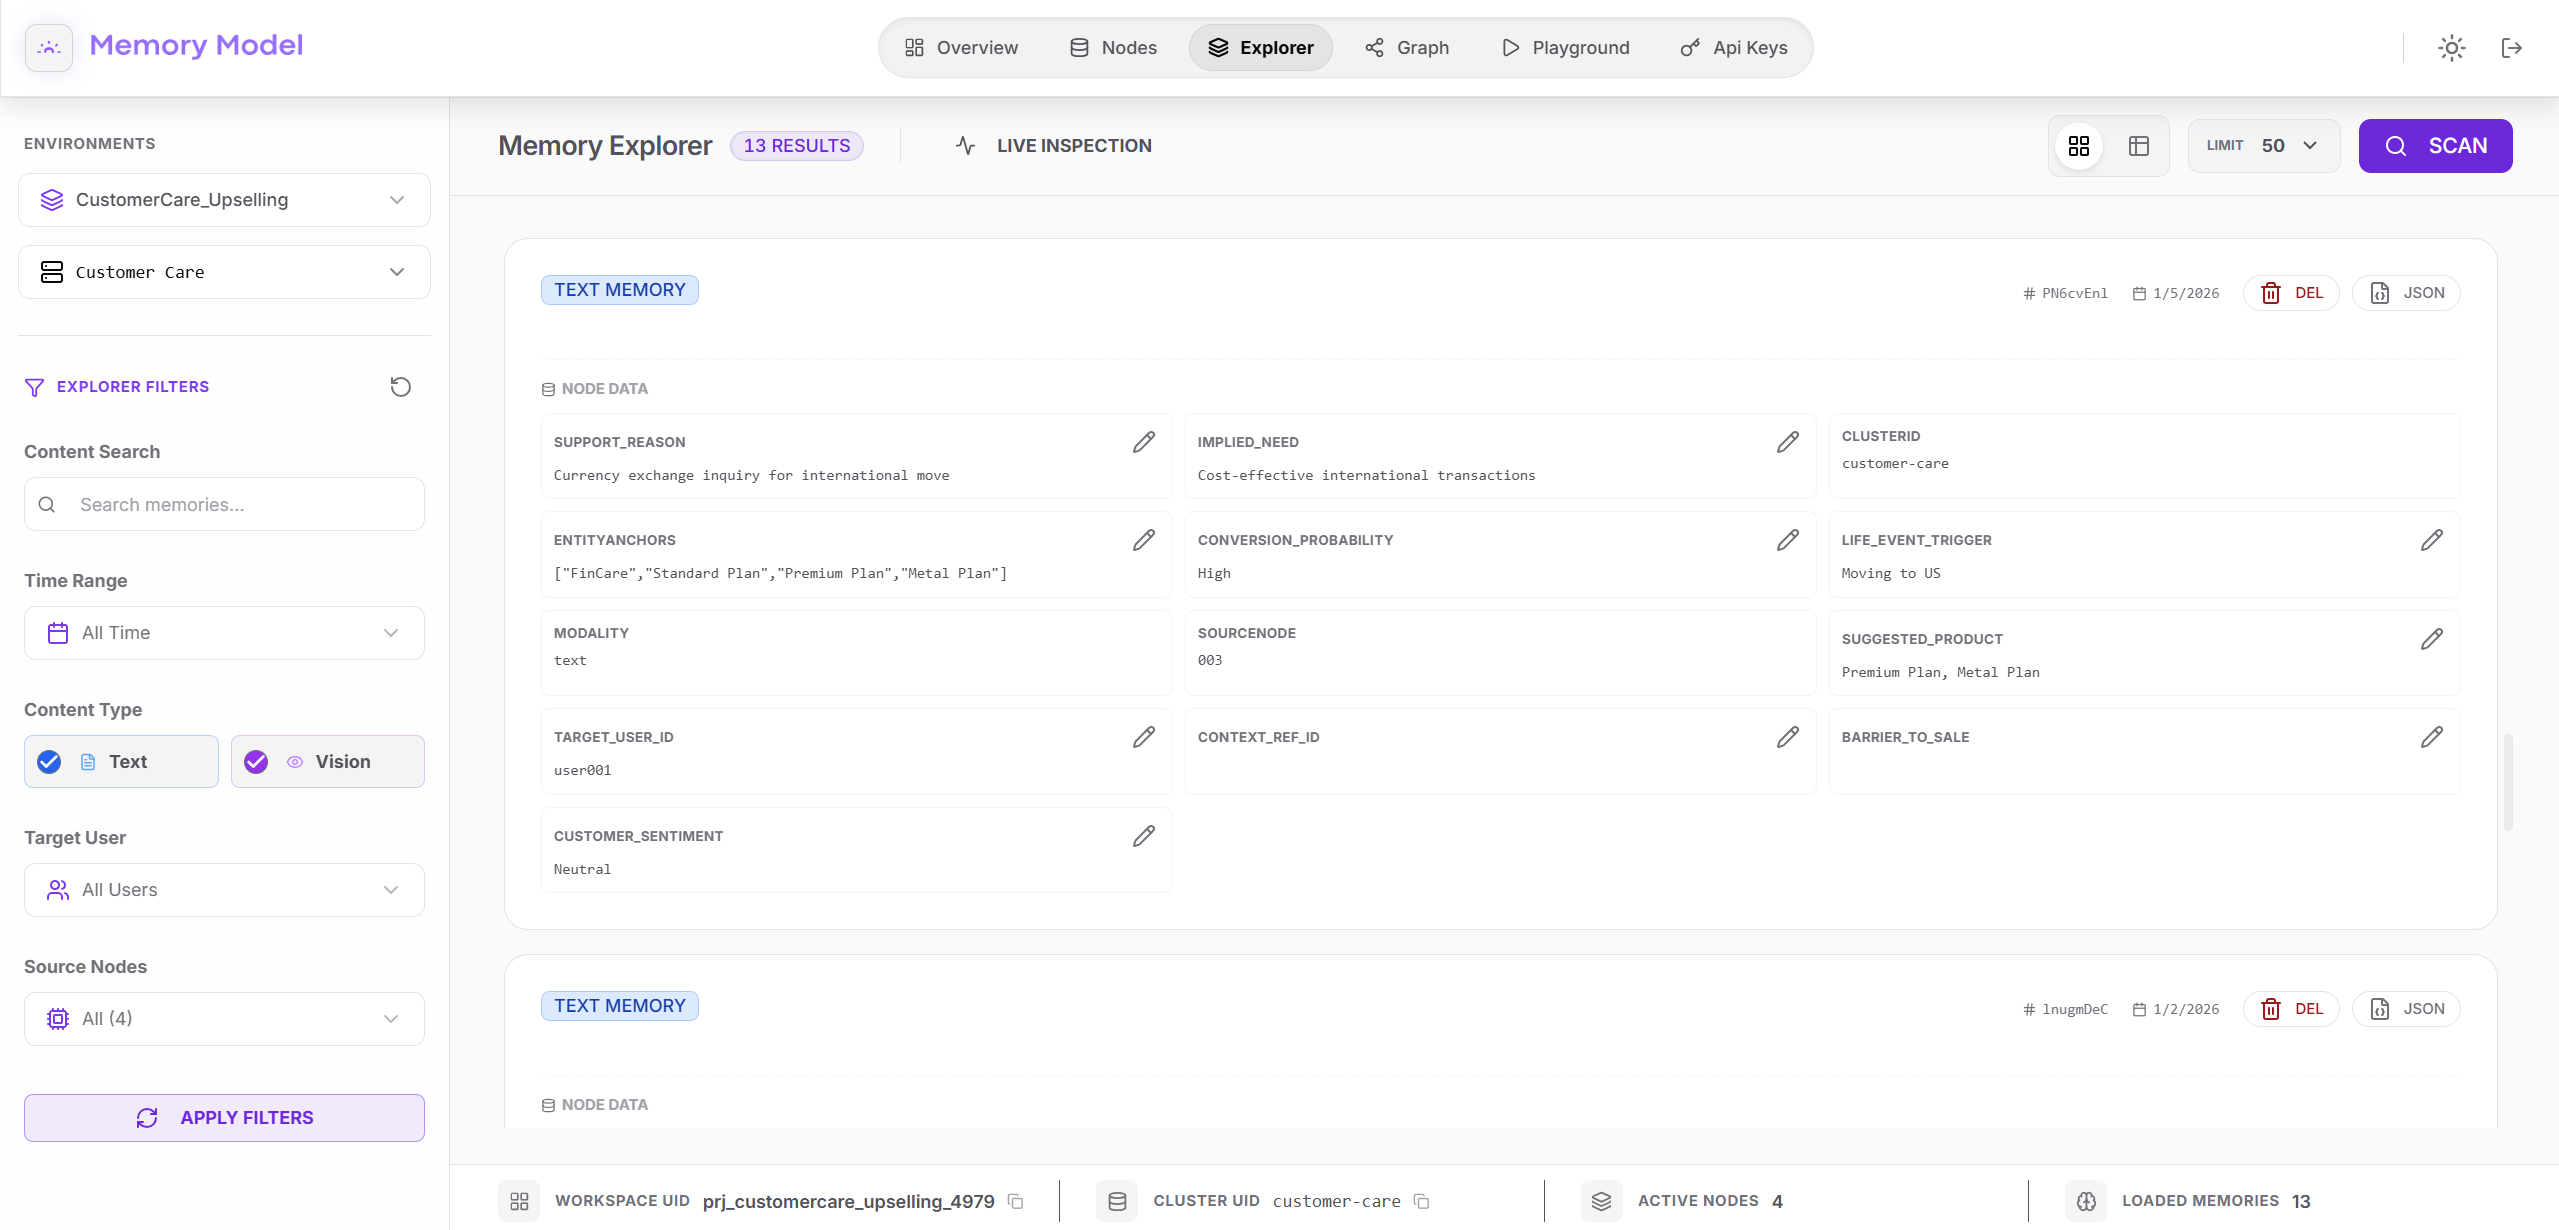
Section titled “Using the Explorer”Filters panel (left sidebar)
Section titled “Filters panel (left sidebar)”On the left side of the Explorer you’ll find a set of filters that let you control which memories are visualized.
You can filter by:
- Content search: Free-text search inside memory content.
- Time range: Restrict memories to a specific time window (or all time).
- Content type: Text memories or Vision memories (if enabled).
- Target user: All users or a specific user (to inspect isolated user memory).
- Source nodes: Choose which memory nodes to include as sources.
These filters are applied before any data is loaded, giving you precise control over what you inspect.
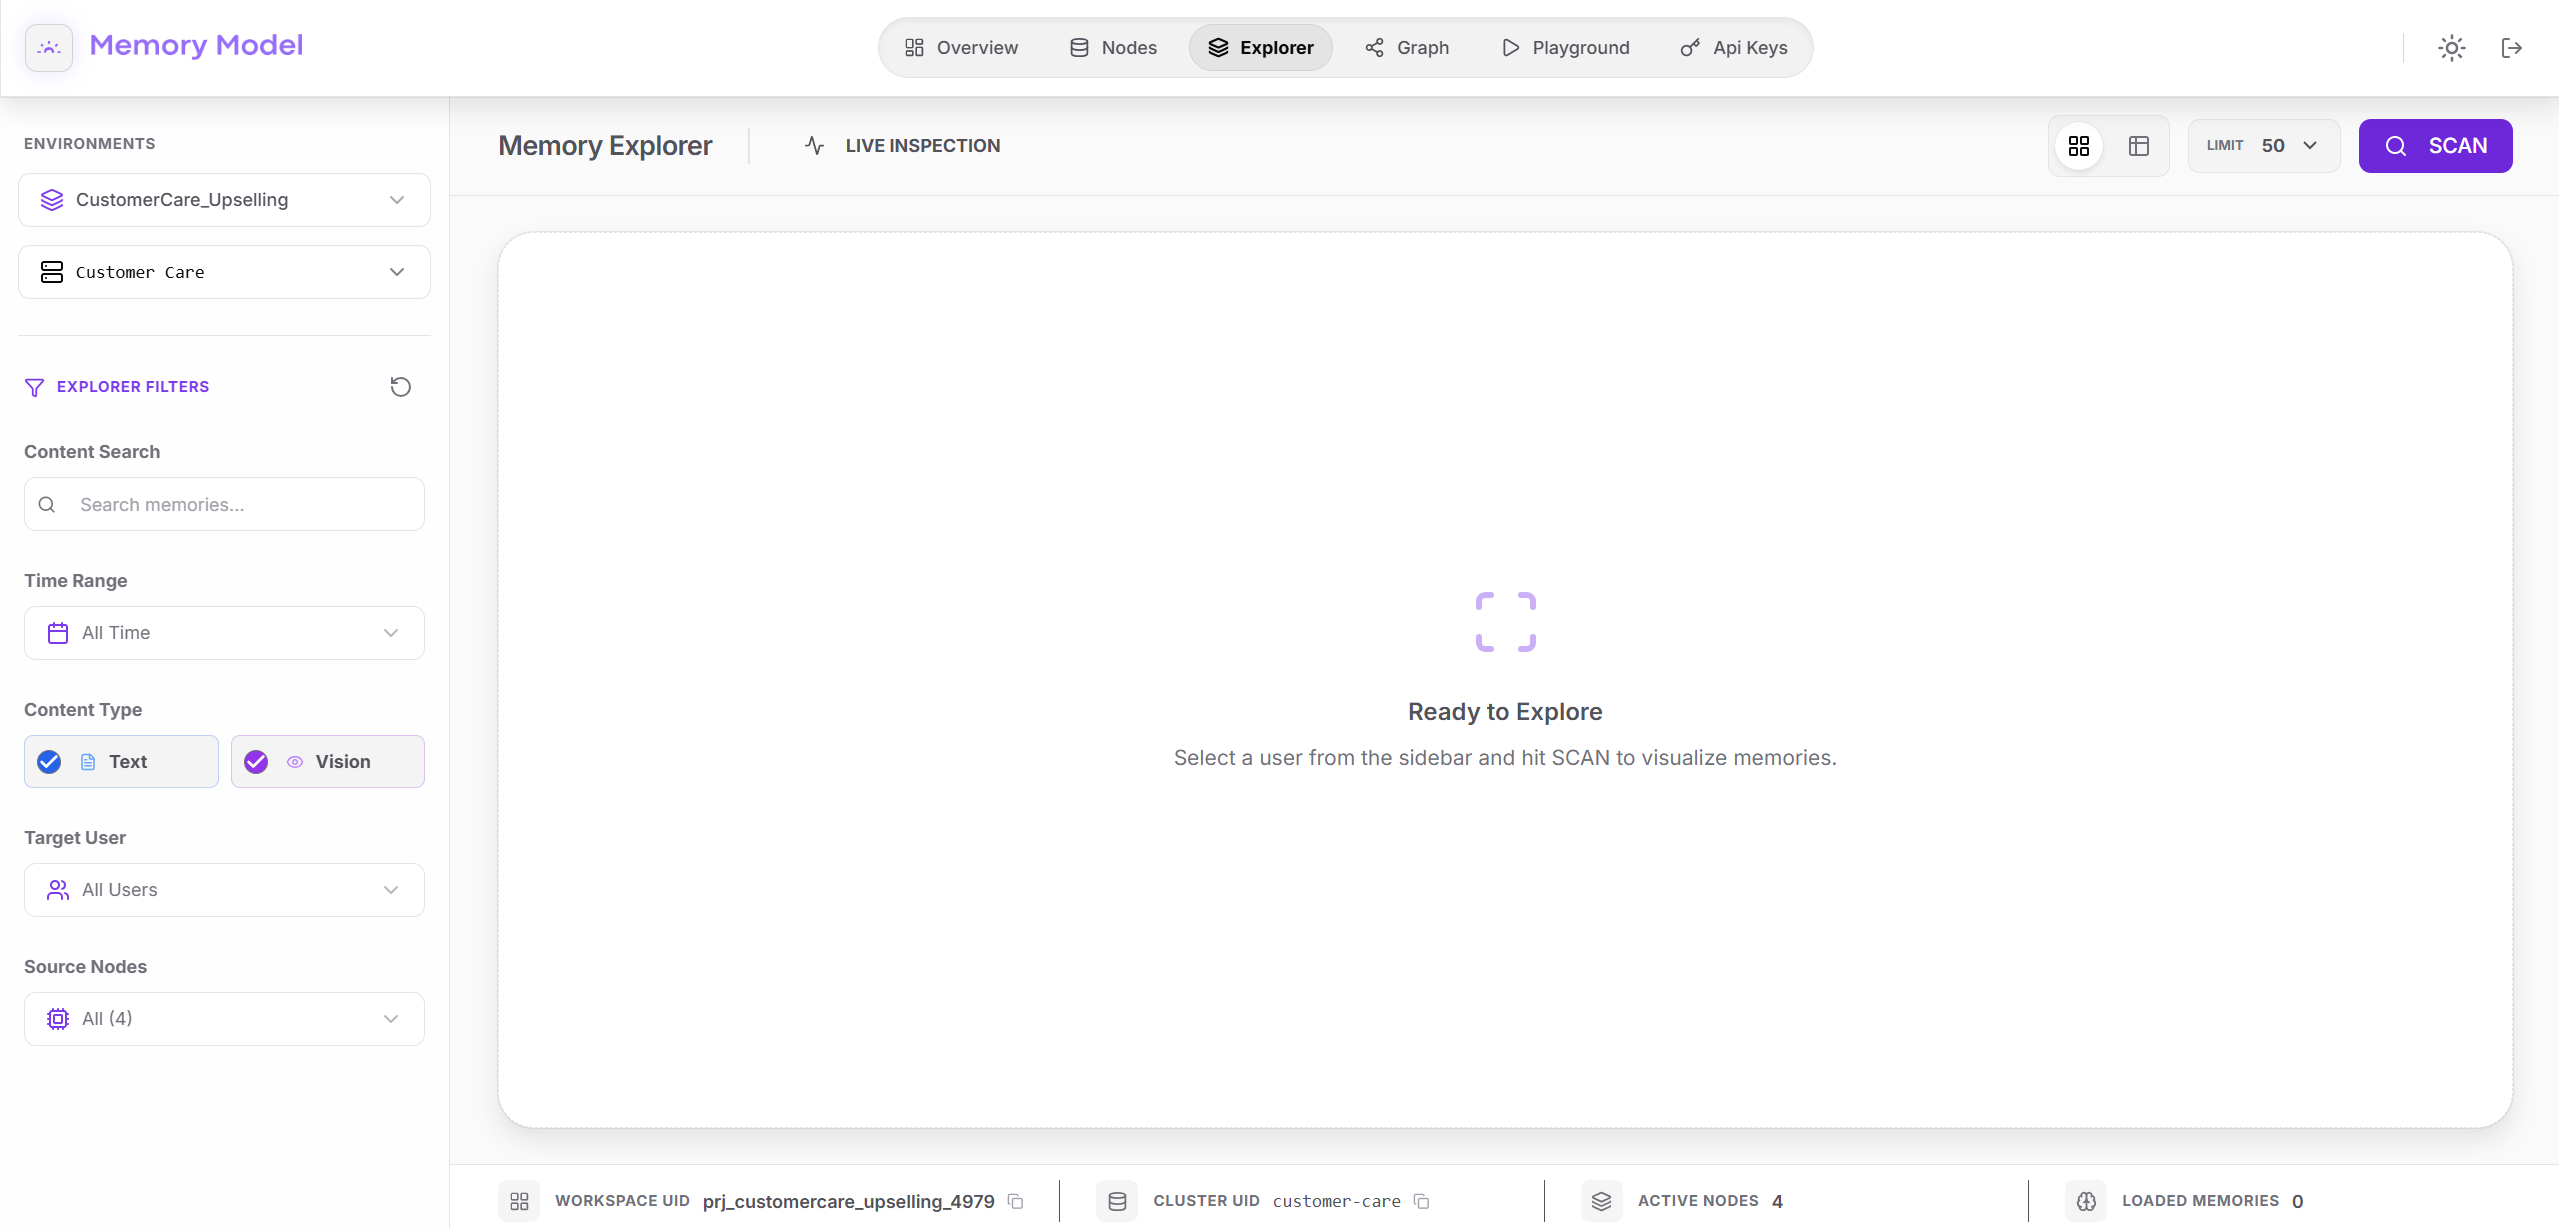
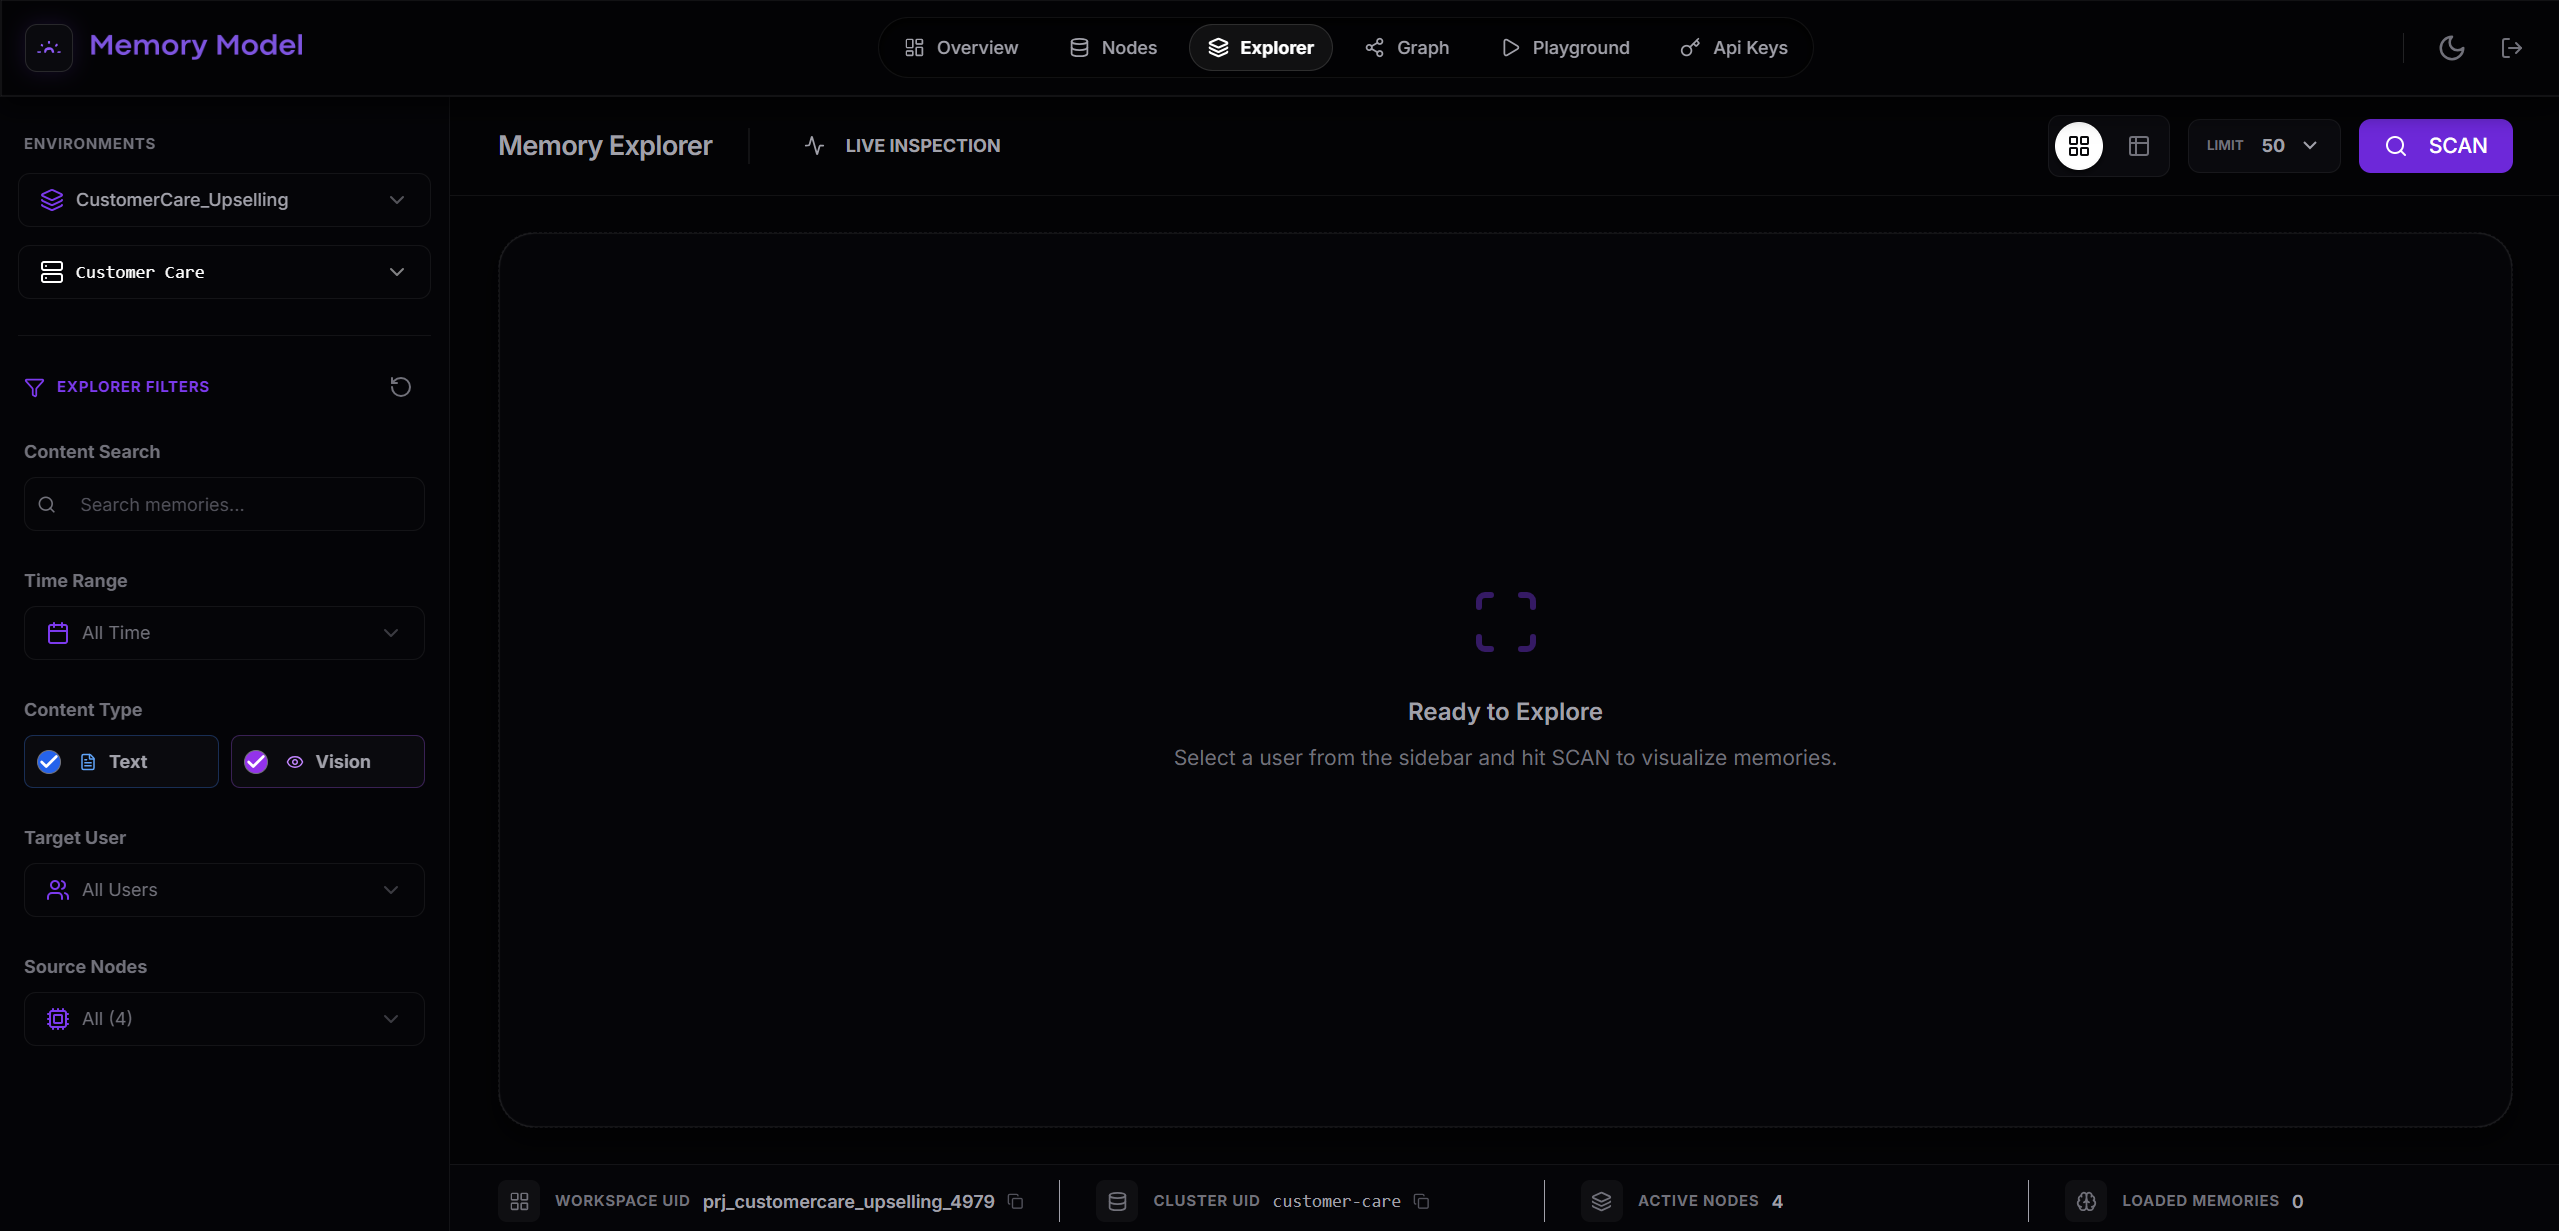
Scanning memories
Section titled “Scanning memories”Once your filters are set:
- Click SCAN in the top-right corner.
- When you press SCAN, the Explorer performs a live inspection of the memory layer using your selected filters.
- You will then see a visual representation of the matching memories.
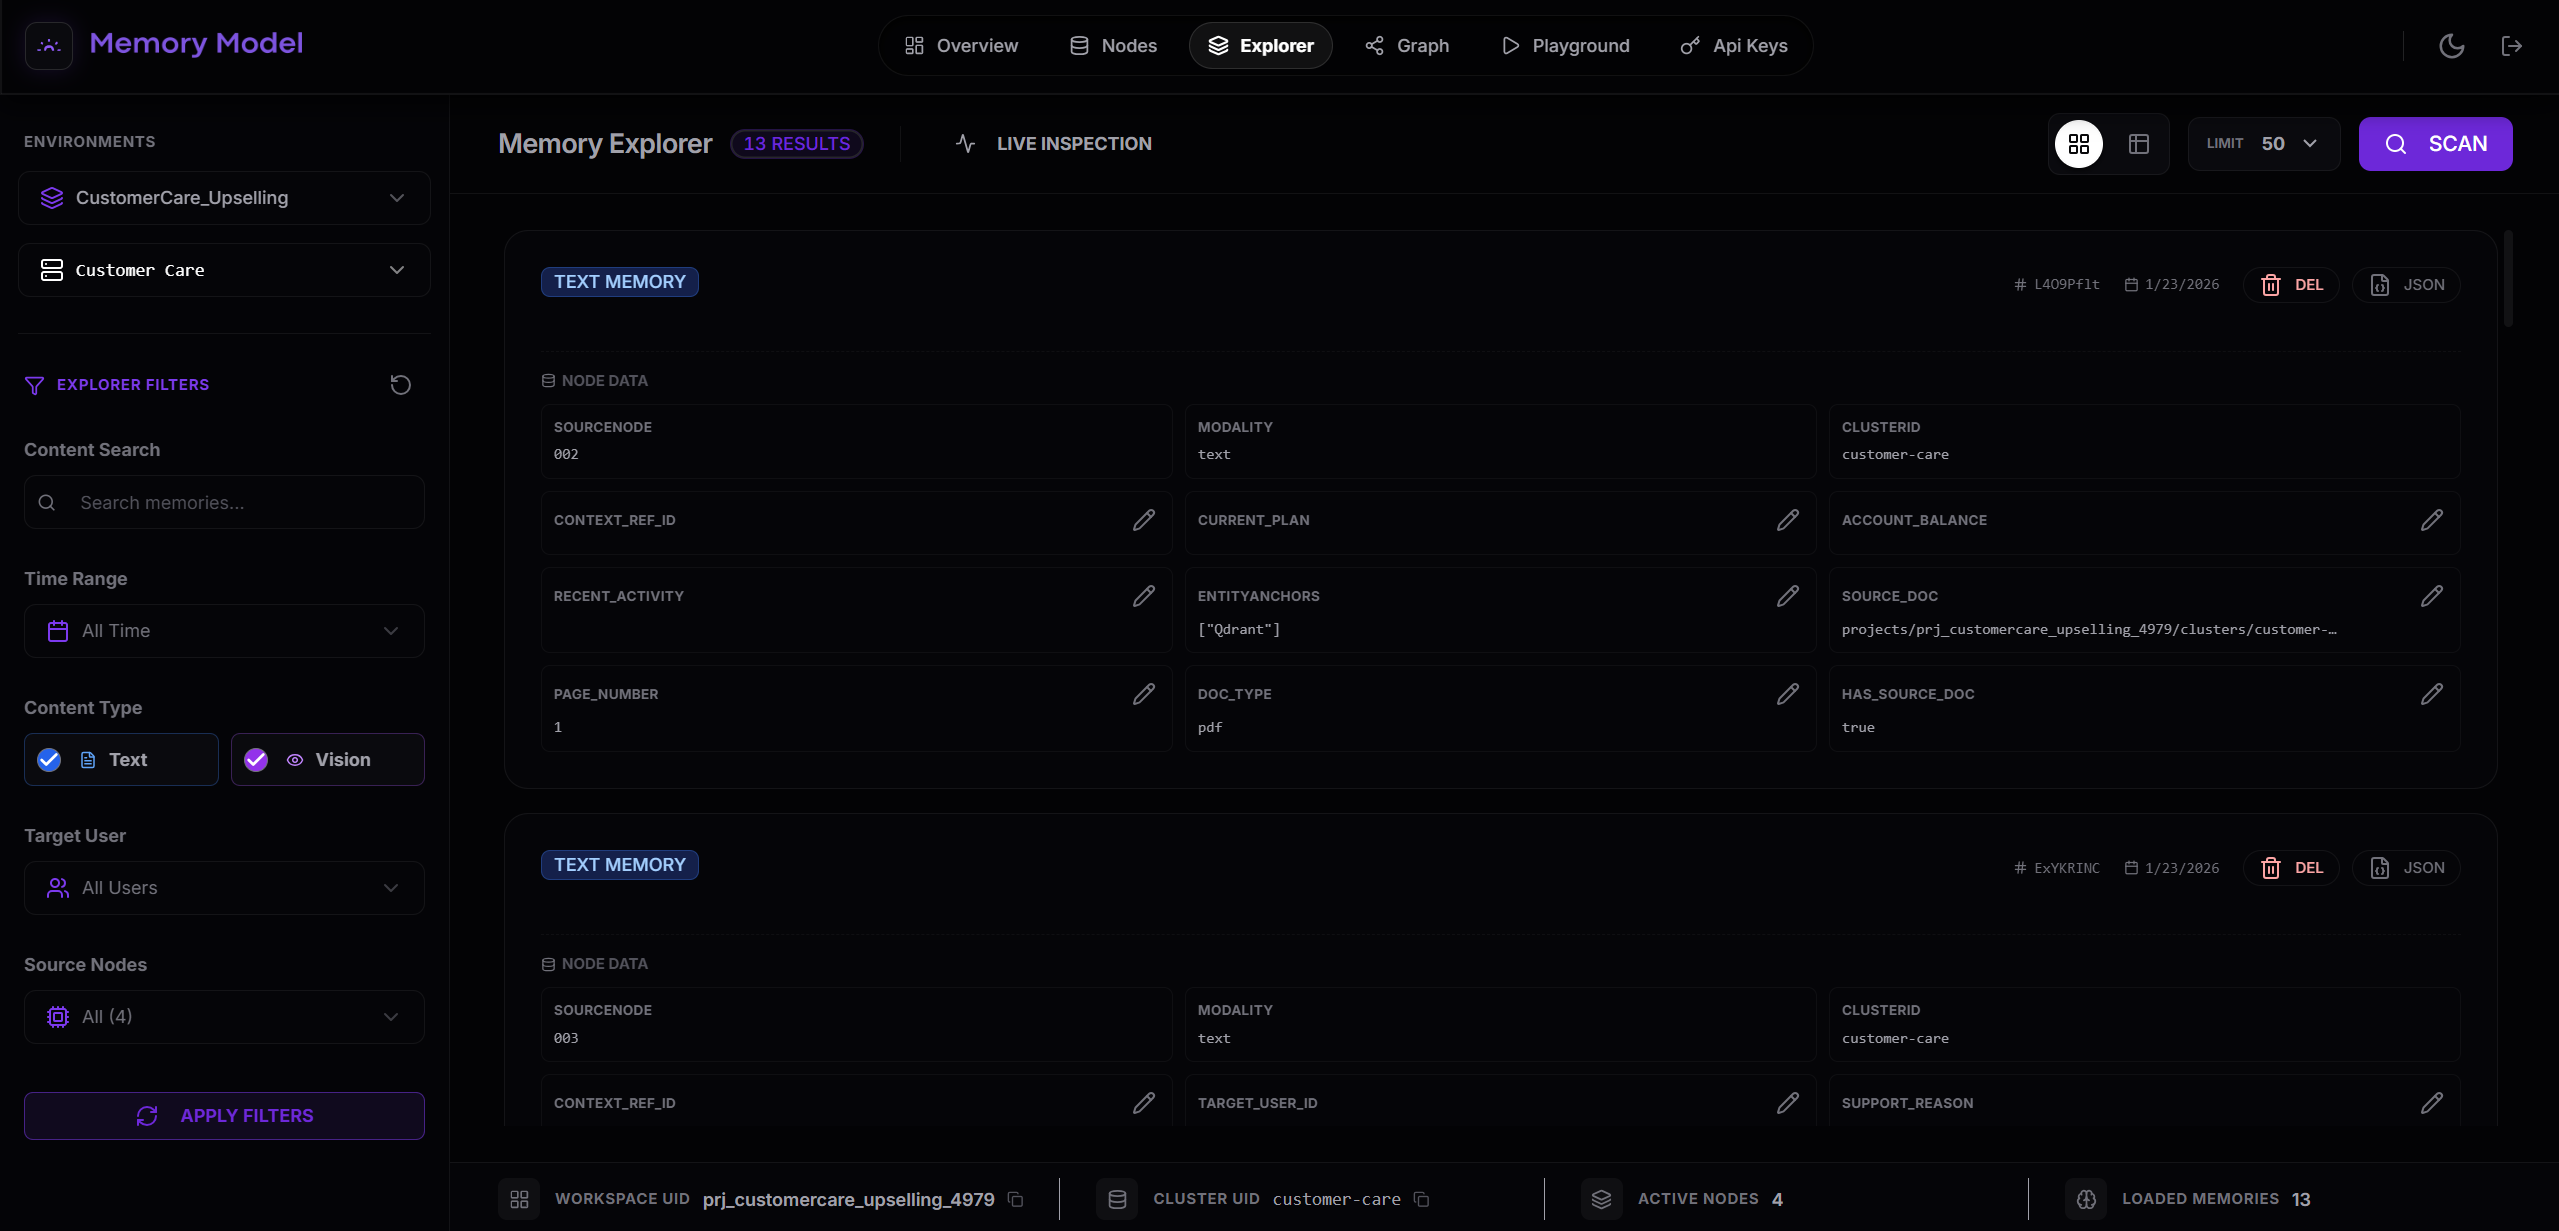
Memory views
Section titled “Memory views”Once memories are loaded, you can change how they are visualized using the view selector in the top-right corner of the Explorer.
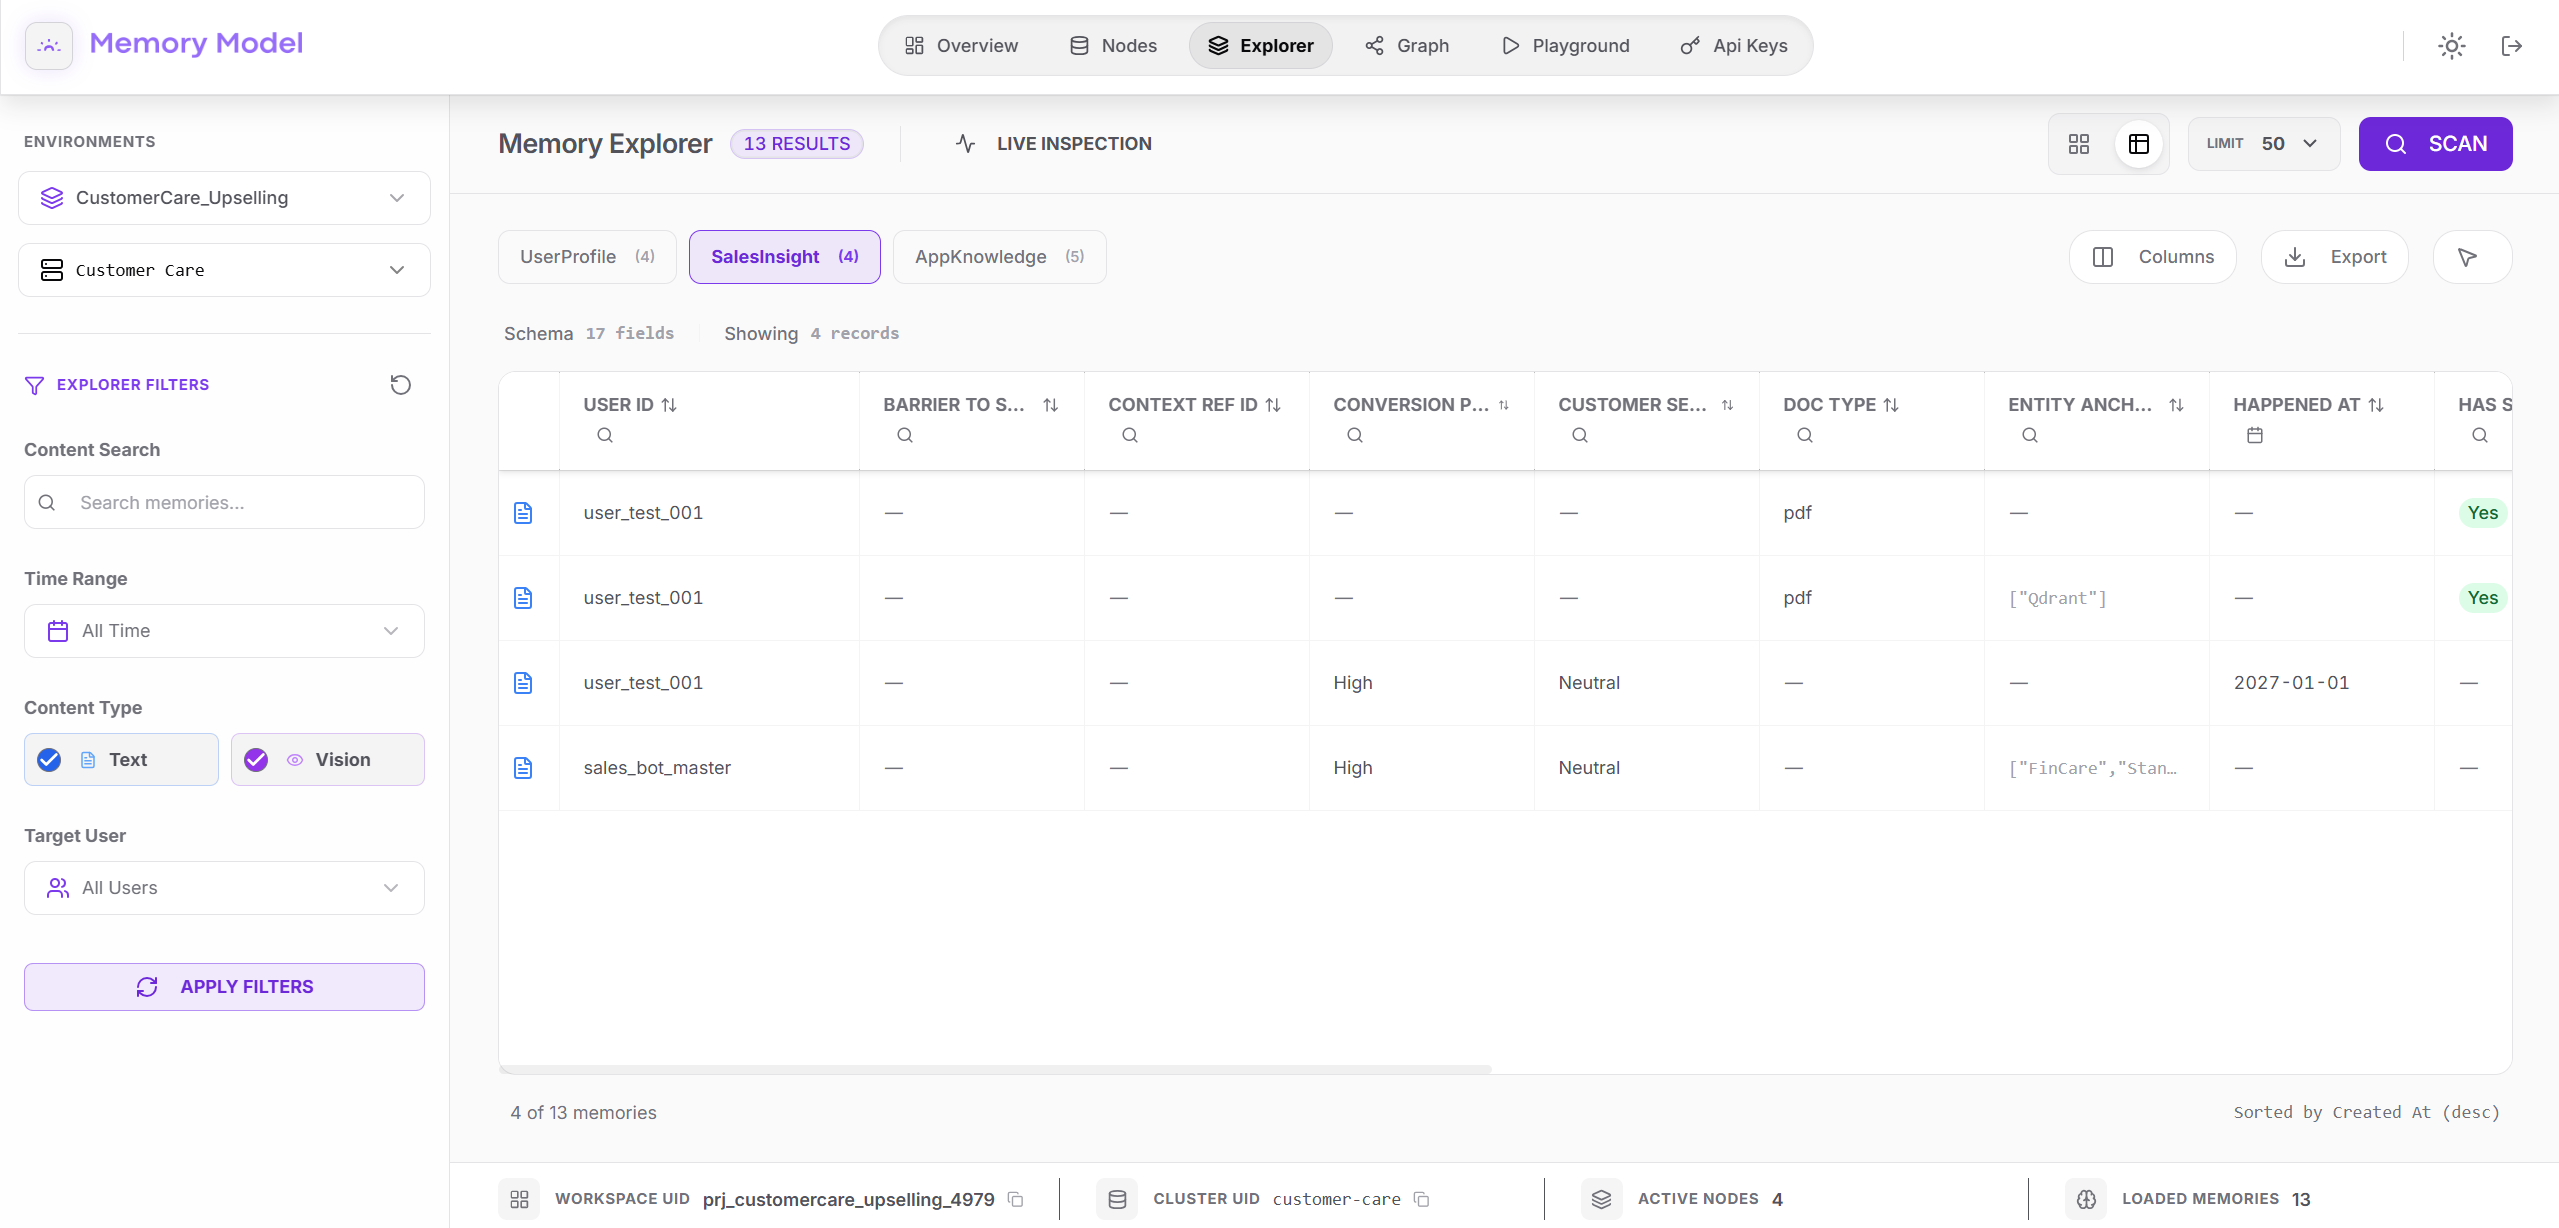
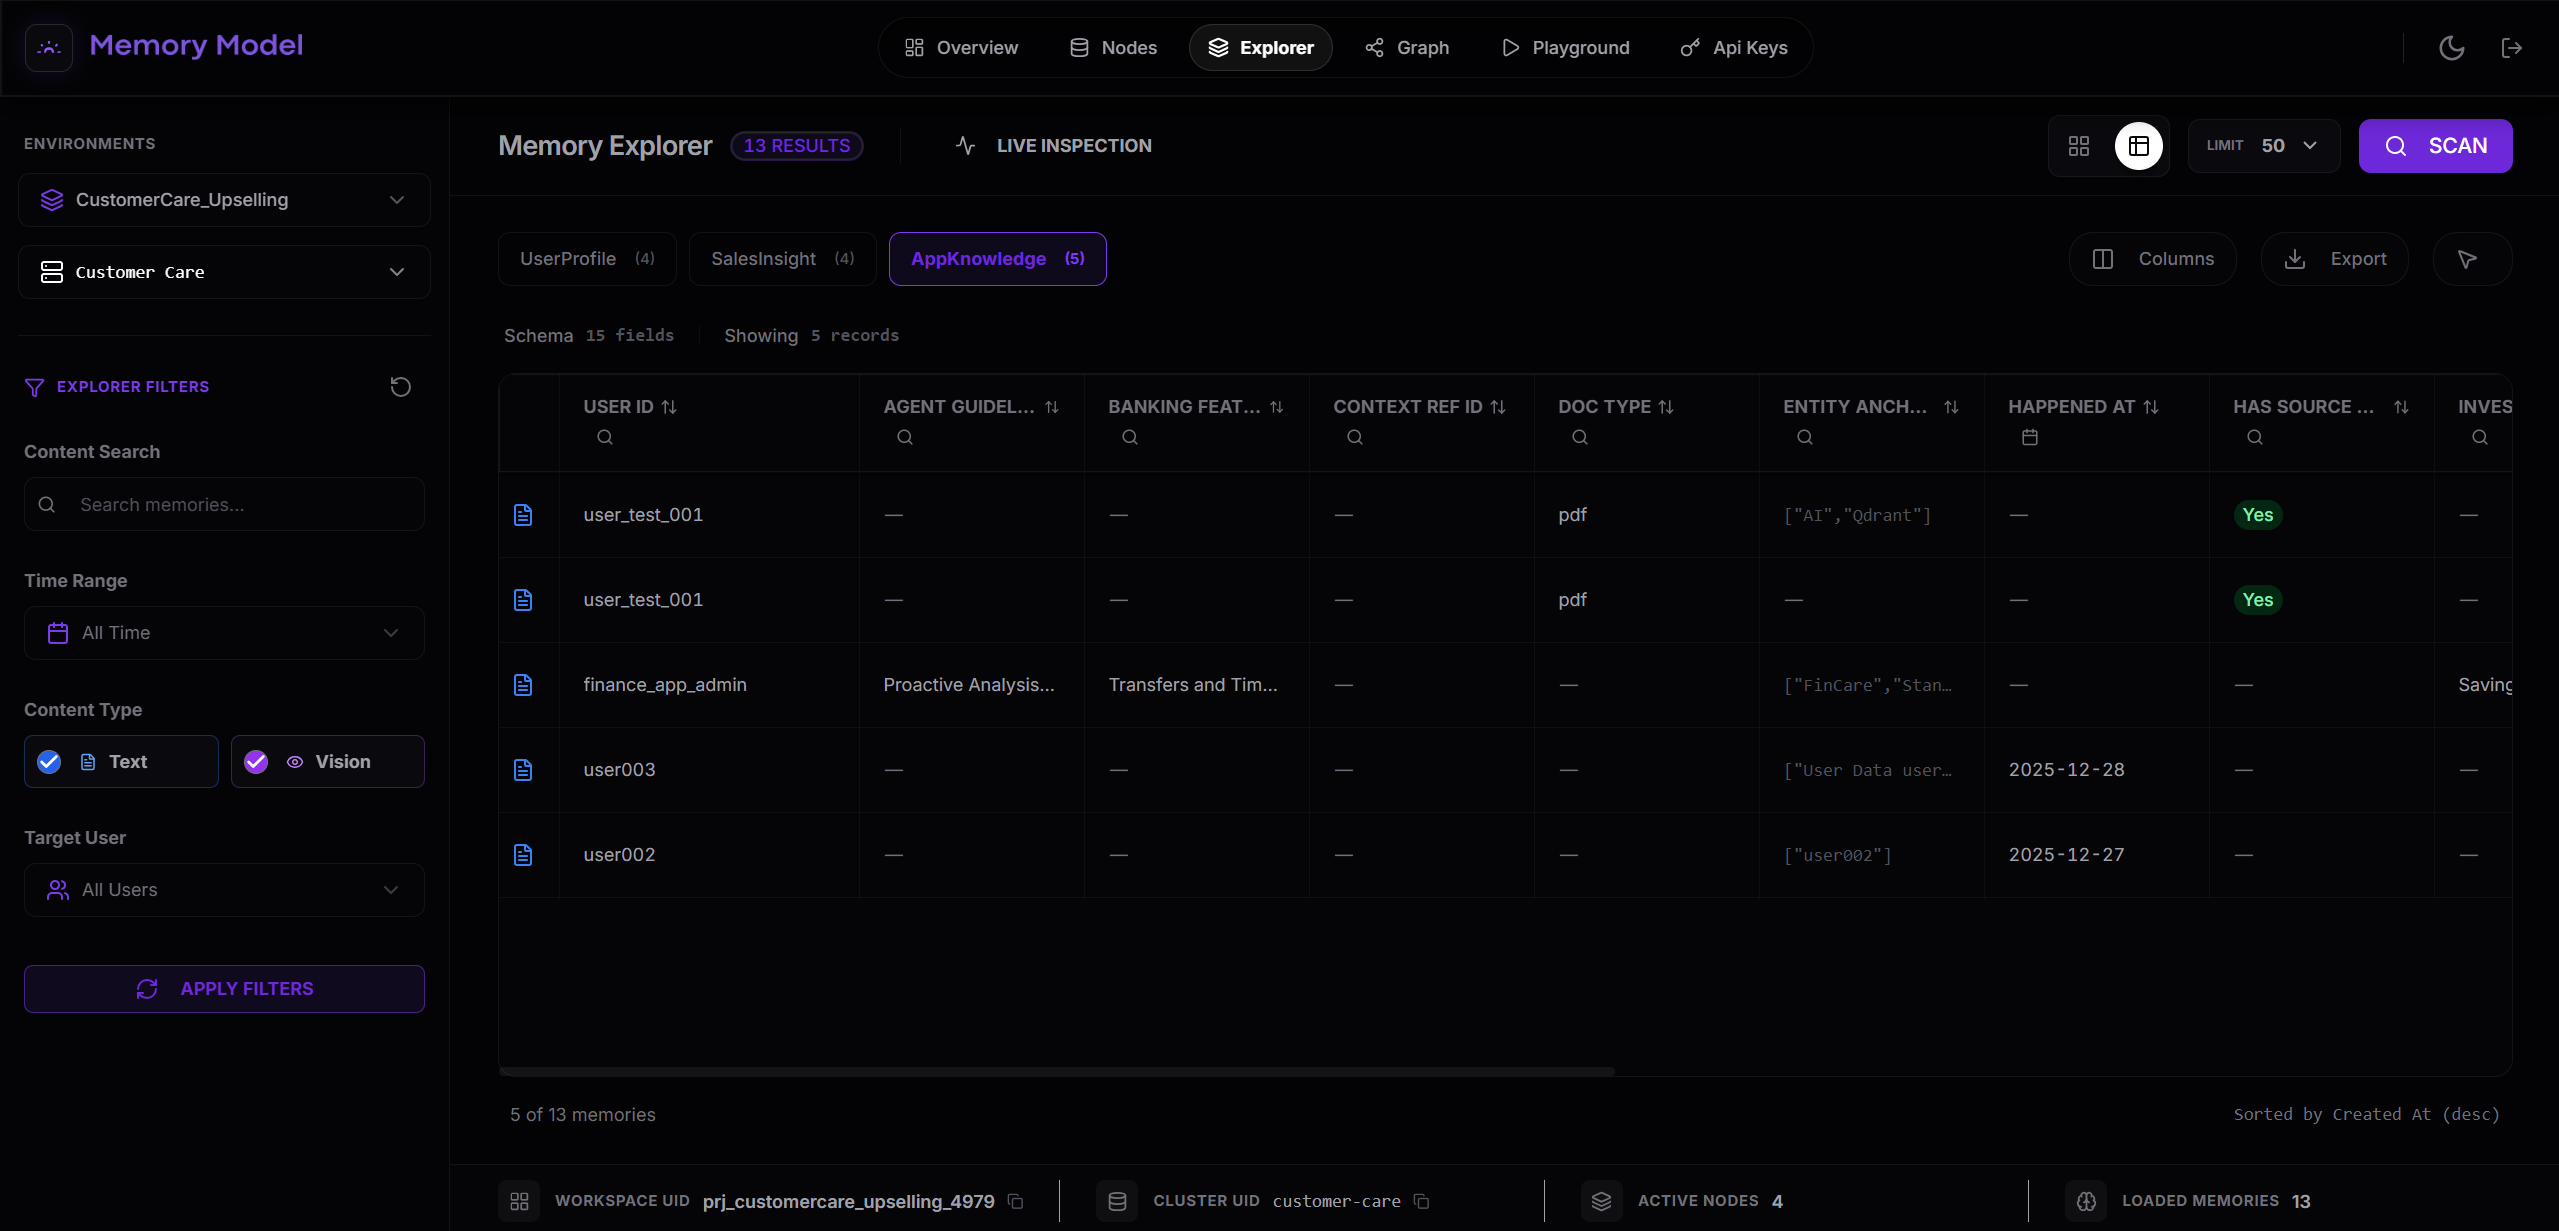
Table view
Section titled “Table view”By clicking on the table view icon, you can switch to a tabular representation of memories.
This view is designed for:
- Inspecting large volumes of memory.
- Scanning and comparing records across users.
- Validating structured fields and schemas.
- Spotting inconsistencies, gaps, or anomalies at scale.
In table view, each row represents a memory record, while columns map to the structured fields of the underlying memory nodes.
This makes it especially useful when working with production agents and high-throughput systems, where understanding memory at scale is critical.